Long lists, tables, and rows of data might contain all of the information needed to make informed decisions, but isolating pertinent information is typically like finding a needle in a haystack. On the other hand, representing information in graphical format (data visualization) makes it easy to identify connections between elements in a system and to gain insights that might otherwise have remained hidden. Business applications of all kinds make extensive use of graphs and other visuals to highlight trends, outliers, opportunities, and threats, bringing actionable observations to light.
Graph technology enables representing interconnected objects in a network. Vertices (nodes) in the network are connected to each other by “edges” (links). The edges can be directed (a one-way relationship) or undirected (a two-way relationship) indicating the type of flow between the vertices. Because the graph is a map of vertices connected by edges, there is no hierarchy.
Uses for graph technology are many and varied. For example, you can use a graph to plot the connections between users on a particular social media platform (Facebook, is an undirected graph where both friends must follow each other; Twitter is a directed graph where person A can follow person B, but person B does not have to follow person A).
Graph technology also enables IT managers to investigate policies from multiple points of view. When you are able to analyze the data from many different perspectives, you can identify where resources or identities require attention. This is because by traversing nodes on a graph, you can join separate data sets and find relationships that you otherwise would never have discovered.
If using visuals to represent data is so useful, why isn’t graph technology widely used for IAM? As a business grows, new departments are created, business units are formed, and projects that might once have been under the purview of one division of the company shift to another. Smart IT managers use PBAC to ensure maximum flexibility and scalability of their IAM system to handle all of these changes.
Access decisions are heavily influenced by graph technologies because it is flexible enough to handle the innate complexity of the system. In a PBAC system, the policies that IT managers create are based on four basic objects:
For example, assume that in a particular organization both Regional Managers and Account Managers can access regional accounts. The IT manager might have defined two different policies that provide the same level of access to the same resources and objects. Without a simple way to construct this decision and view this kind of information, it would be very difficult to identify the full impact of who can and cannot access regional accounts.
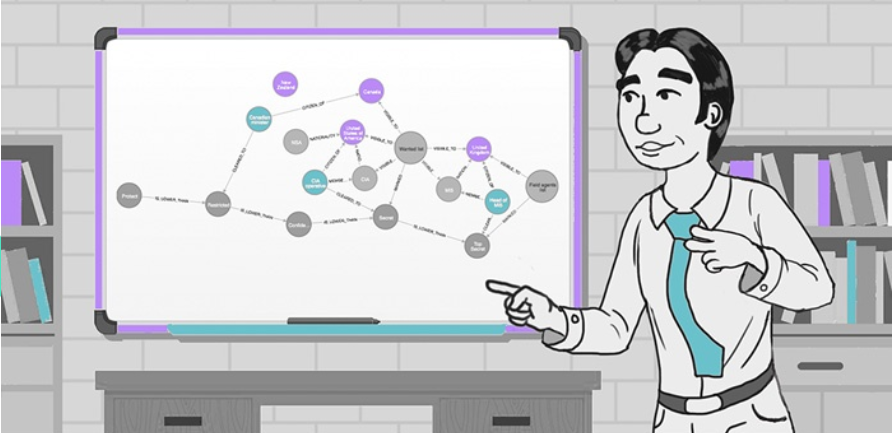
In other words even with a comprehensive PBAC system, personnel reassignments, onboarding of new staff, and project reallocations can create a highly complex environment in which to manage user identities and access controls. Using graph technology to build the access decisions and then see which users have access to resources in the organization, and the conditions under which they can access them, turns IAM from a complicated system to a clear, visual, easy-to-follow graphic.
“...the flexibility of the graph model is perfect for representing the data for policy decisions.”
A graphical representation of the user-management system is instrumental for IT managers and IAM professionals to understand the structure of IAM in their organization and see which users have access to which resources, under which circumstances, and in which conditions. With that information, they can formulate efficient policies with properly defined attributes (the “who”, “when”, “what”, and “how”), reduce confusion, and manage user access and authorization more effectively.
When it comes down to quickly and easily understanding the way the organization handles IAM, the graph representation makes it easy for CISOs and other stakeholders to visualize the current state and to make well-informed decisions. Furthermore, full and clear visibility of all properties, classifications and attributes in an organization’s PBAC policies enables risk and compliance officers to identify gaps as well as ensure that the way the company manages IAM meets all legal requirements, company guidelines, and industry standards.
Ask for a demo to see how PlainID can help your organization take control of IAM with graph technology and PBAC.